17431 North Black Canyon Highway
Phoenix, AZ 85023
Listing ID: 315962
- Property Type Industrial : Flex/Office Warehouse
- Lot Size Acres 1.640
- Building Sq Ft 26,320
- Building Price per Sq Ft $186.17
- Land Sq Ft 71,438
- Land Price per Sq Ft $68.59


Property Highlights
• Perfect North Central Location
• Gated Yard Area in rear of building
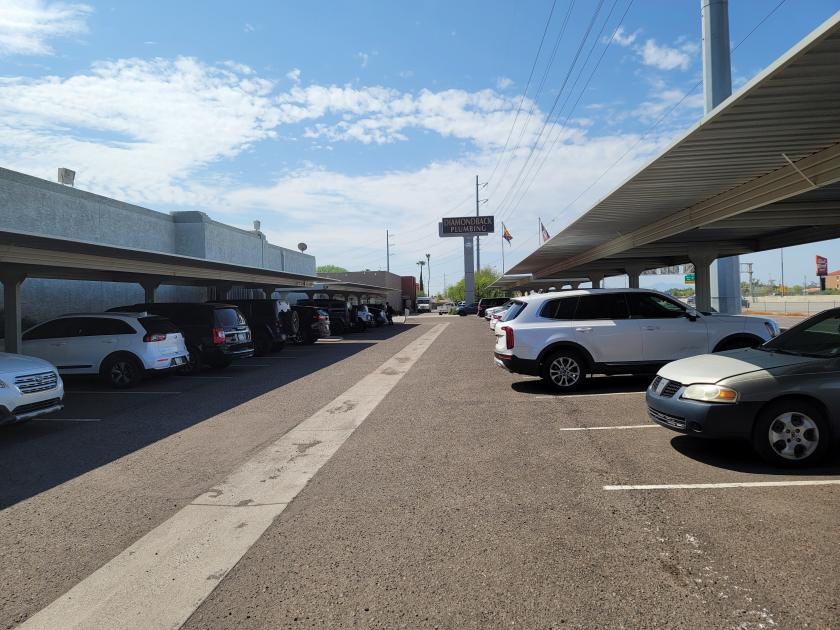
• Covered Parking in Front
• A/C and Evap available in warehouse
Attachments & Files
Listing Demographics
Information based on the most recently available data (updated annually) and is provided in 1-mile, 3-mile, and 5-mile radii (radiuses) of the property location.
| 1-Mile | 3-Miles | 5-Miles | ||
|---|---|---|---|---|
| Total Population | 16,497 | 141,444 | 318,327 | |
| Population Median Age | 39 | 38 | 38 | |
| Population by Age | 0-9 Yrs | 1889 (11%) | 17888 (12%) | 38718 (12%) |
| 10-19 Yrs | 1576 (9%) | 14704 (10%) | 36511 (11%) | |
| 20-29 Yrs | 2797 (16%) | 23182 (16%) | 50883 (15%) | |
| 30-39 Yrs | 2426 (14%) | 22328 (15%) | 48361 (15%) | |
| 40-49 Yrs | 1853 (11%) | 17492 (12%) | 39309 (12%) | |
| 50-59 Yrs | 2519 (15%) | 18746 (13%) | 41611 (13%) | |
| 60-69 Yrs | 1792 (10%) | 14330 (10%) | 33328 (10%) | |
| 70+ Yrs | 1644 (9%) | 12774 (9%) | 29605 (9%) | |
| Median HH Income | $61,209 | $69,585 | $70,460 | |
| Total Household Income | < 24K | 1081 (15%) | 7997 (13%) | 18089 (14%) |
| 25-49K | 1713 (24%) | 12622 (21%) | 26425 (20%) | |
| 50-74K | 1365 (19%) | 10578 (18%) | 23264 (18%) | |
| 75-99K | 899 (12%) | 8088 (13%) | 18674 (14%) | |
| 100-199K | 1669 (24%) | 15307 (26%) | 32977 (25%) | |
| 200K+ | 210 (3%) | 3424 (5%) | 8484 (6%) | |
| Highest Education Level | No Diploma | 1155 | 8907 | 22116 |
| Diploma or GED | 3265 | 25989 | 53302 | |
| Some College | 3149 | 27453 | 58303 | |
| Assoc. Degree | 1194 | 9806 | 22190 | |
| Bachelors Degree | 2262 | 17982 | 41819 | |
| Higher Degree | 928 | 8647 | 22452 | |
| Total Housing Units | 7,486 | 60,890 | 134,103 | |
| --Owner-Occupied | 3,795 | 33,622 | 75,536 | |
| --Renter-Occupied | 3,142 | 24,392 | 52,377 | |
| Owner-Occupied Values | < 100K | 474 | 2361 | 5365 |
| 100-199K | 322 | 3231 | 6928 | |
| 200-299K | 1502 | 11823 | 23379 | |
| 300-399K | 1025 | 9502 | 20677 | |
| 400-499K | 348 | 3565 | 9864 | |
| 500K+ | 124 | 3140 | 9324 | |
| Total Working Age Population | 13,591 | 113,973 | 258,629 | |
| In Work Force | 9,081 | 79,335 | 176,225 | |
| Not In Work Force | 4,510 | 34,638 | 82,404 | |
| Workforce Employed | 8,572 | 75,426 | 166,896 | |
| Workforce Unemployed | 509 | 3,808 | 9,160 | |
| Civlian Workforce | 9,081 | 79,234 | 176,056 | |
| Military Workforce | 0 | 101 | 169 | |
| Total Households | 6,936 | 58,014 | 127,913 | |
| Family Households | 3,873 | 34,936 | 78,090 | |
| Non-Family Households | 3,063 | 23,079 | 49,823 | |
| Married Couple | 2,423 | 23,317 | 52,270 | |
| Other Family | 1,450 | 11,619 | 25,820 | |
| Married w/Child | 903 | 9,231 | 20,276 | |
| Single Male w/Child | 175 | 1,887 | 4,033 | |
| Single Female w/Child | 536 | 3,543 | 8,379 | |
Population Change Last Two Decades - Plus Projection
| 2000 | % | 2010 | % | 2020 | % | 2030 | |
|---|---|---|---|---|---|---|---|
| Arizona | 5,130,632 | +25 | 6,392,017 | +12 | 7,151,502 | +16 | 8,313,800 |
| Maricopa County | 3,072,149 | +24 | 3,817,117 | +16 | 4,420,568 | +18 | 5,200,400 |
No part of this information may be copied, reproduced, repurposed, or screen-captured for any commercial purpose without prior written authorization from MyEListing.
While we strive to provide the most accurate information, all listing information, and demographic data, is provided by third-parties. As such, MyEListing will not be responsible for the accuracy of the information. It is strongly recommended that you verify all information with the listing agent, and any relevant agencies, prior to making any decisions.
Listing Location & Map Views
Listing Agent

More listings from Susan McCall


Featured Vendors
• SUPPORT THIS FREE PLATFORM •
The below vendors allow the platform to be provided at no cost. Please consider their
services when needed.
services when needed.
• Commercial Mover •
It's stressful enough. We can help.
• Plumbing Contractors •
Get it all flowing again with a click!
• Painting Contractor •
• Landscape •
• Flooring Contractor •
• Plumbing Contractors •
Get it all flowing again with a click!